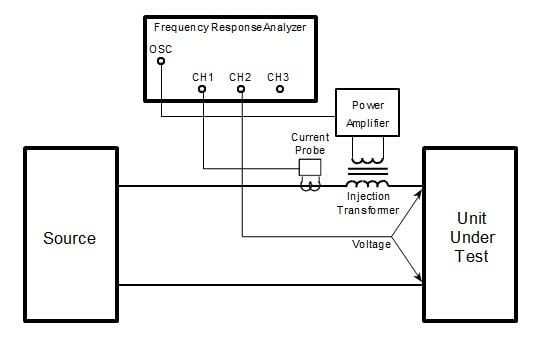
There is almost always the occasion when one asks oneself “Is this thing working?”, and having a straightforward way to demonstrate the answer is invaluable. The basic premise behind this test is to determine if the input channels are measuring the correct voltage and the generator output voltage is correct. In the case of a Venable Instruments’ Frequency Response Analyzer (FRA), this article discusses how to perform a loopback test that will exercise the oscillator output, input measurement channels, test leads, PC communications and software. The sanity check is a good test to run when setting up your FRA for the first time and is handy when things “just don’t look right”. The sanity check setup assumes a two channel FRA, but it can be used on three and four channel FRAs with equal effectiveness.
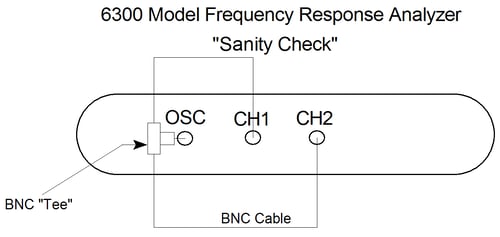
Figure 1 Sanity Check Test Setup
Once the FRA is powered up and the USB or GPIB cable is connected to the PC that is running the Venable Stability Analysis Software, follow these steps:
- You can use two BNC cables and a BNC “Tee”, as shown in Figure 1, or hook up the BNC to Mini-grabber cables that come with the system to the oscillator output and to each of the inputs of the FRA. Connect all the black (-) Mini-grabbers together and all the red (+) Mini-grabbers together.
- Open the Stability Analysis software. For version 5 software, open the Analyzer Control menu to establish communication. For version 6 software, go to the Analyzer program menu and select the analyzer to enable communication. The Analyzer Control docking window should no longer be grayed out once the software has made the communication connection to the analyzer. Set the Start Frequency to 10 Hz. Set the AC Volts Out to 1 Volt peak.
- Click the "Take Data at Start Frequency" button in the Analyzer Control window. The Readings window, in version 6, should then display the following values based on the two channel analyzer model. In version 5, the readings are displayed on the Analyzer Control menu. Since the signal present at the Channel 2 input is the same as Channel 1, the ratio of the two will result in measurements very close to 0dB gain and 0˚ phase. The oscillator output is set using Volts peak and the channels measure Volts rms, so 1 Vpk will be measured at about 707.1 mV rms.
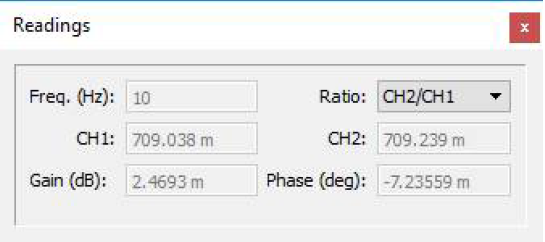
Figure 2 Readings
-
- If desired, one can run a sweep over frequency to check for operation over the entire bandwidth of the instrument. Set the Stop Frequency to 100 kHz and click on the Run Sweep button. If everything is working correctly the plot will look like the one in figure 3 below. All the voltage readings will be at about 707.1 mV rms and the gain and phase will be very close to 0 dB and 0 degrees across the entire sweep. You can check the values by clicking on and selecting the plot and then clicking on the slide bar button. Click on and drag the slide bar to check values at any frequency.
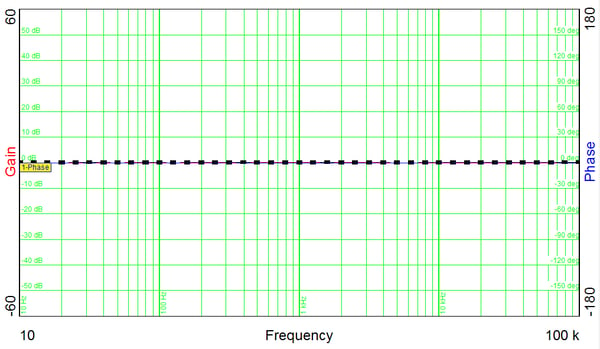
Figure 3 A Good Plot
What if the plot is not good, as seen in Figure 4 below? This is a plot of an analyzer with a malfunctioning channel. In this case, you can only determine which channel is not working by examining the channel voltage readings as shown in Figure 5. The AC Volts Out for this sweep was set to 1 Volt peak. Only channel 2 is reading correctly. Channel 1 is reading very low voltage. Another indication that the channel might be not be working is if the LED above the channel is not illuminated as seen in Figure 6. This indicates that the channel is overloaded and cannot clear the overload.
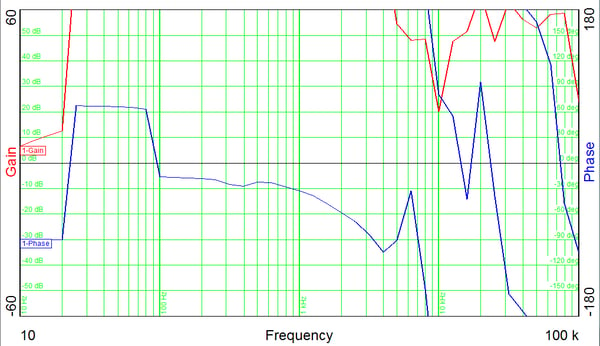
Figure 4 Plot of an Analyzer with a Bad Channel
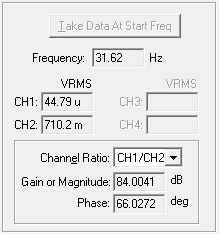
Figure 5 Bad Channel Reading
If the test result is bad, the test cables or BNC “Tee” should be verified as good (they do wear out). Swapping the cables between channels or wiggling the cables during another sweep can usually evidence a bad cable or connection. The plot and readings will vary significantly if there is any discontinuity in the cable connections.
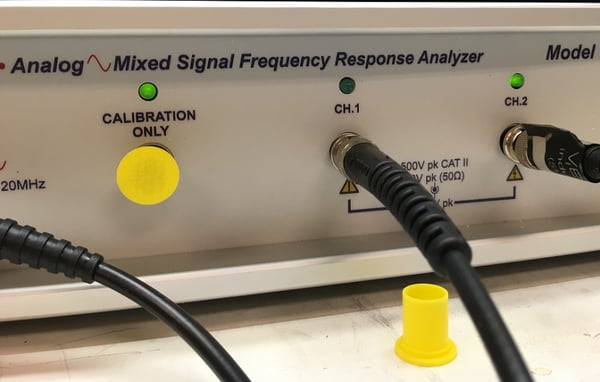
Figure 6 Channel LED Off
If the oscillator is malfunctioning, often times you will get a good flat 0 dB, 0 degrees phase plot but the channel readings will be wrong compared to AC Volts output setting. Another common scenario is that the plot will be very noisy with both channels reading very small values. It is very unlikely in these cases that both channels have failed and the likely culprit is oscillator. The oscillator output should be checked with an oscilloscope to verify the failure.
If the sanity check does not establish the proper operation of your FRA, please contact Venable Instruments for assistance. We will be more than happy to help get any issue resolved.