Introduction
Attention Engineer! Your boss wants you to model a complicated system, design a device to counteract system instabilities and reach set points, work with manufacturers and distributors to fabricate a prototype, and then test and confirm that your device works according to the desired specifications. And he wants this done pronto! So you make a plan: First you’ll measure the response of the system with a few instruments, then spend countless hours modeling the system parameters in the time domain. You’ll grapple with every element of the model to design a device capable of attenuating the system response, then fabricate and test the device, which will, of course, require extensive re-calibration. Then you’ll test and tweak your device until you’ve finally met the desired specifications and are ready to pitch the device to the customer. All the while, you’ll be bouncing from one software to another, trying to keep your data and results organized. That’s just how it’s always been done, right? Not anymore. With a simple modification, you just might be able to drastically improve your efficiency and your customers’ confidence in your work product. Moving your analysis into the frequency domain might mean the difference between hours of extensive calculus and a just little bit of algebra at the touch of a button.
The Practical Perspective...
Let’s consider the following example. You are working on a new shock absorber with varying stiffness and damping, like the one pictured below. Because of the innovative nature of this device, it would be difficult to rely on traditional algorithms for determining design parameters like the stroke and piston lengths, spring parameters and serial/parallel arrangements. So it takes you some time to calculate the dynamics necessary to select the design parameters. After this process, you now have a theoretical shock absorber and are ready to move to next steps.
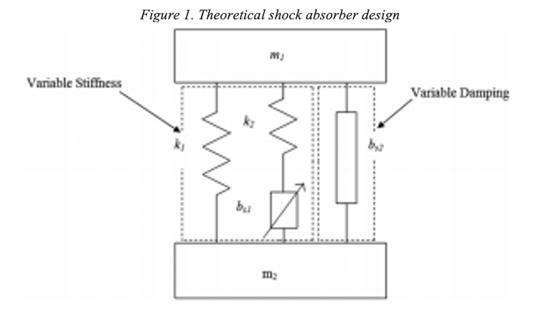
Source: Analysis of suspension with variable
stiffness and variable damping force for
automotive applications
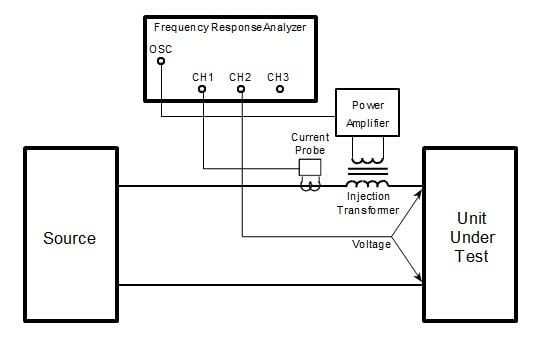
You coordinate with contractors, engineers and suppliers to produce an instrumented prototype, and spend days collecting performance data to analyze the system.
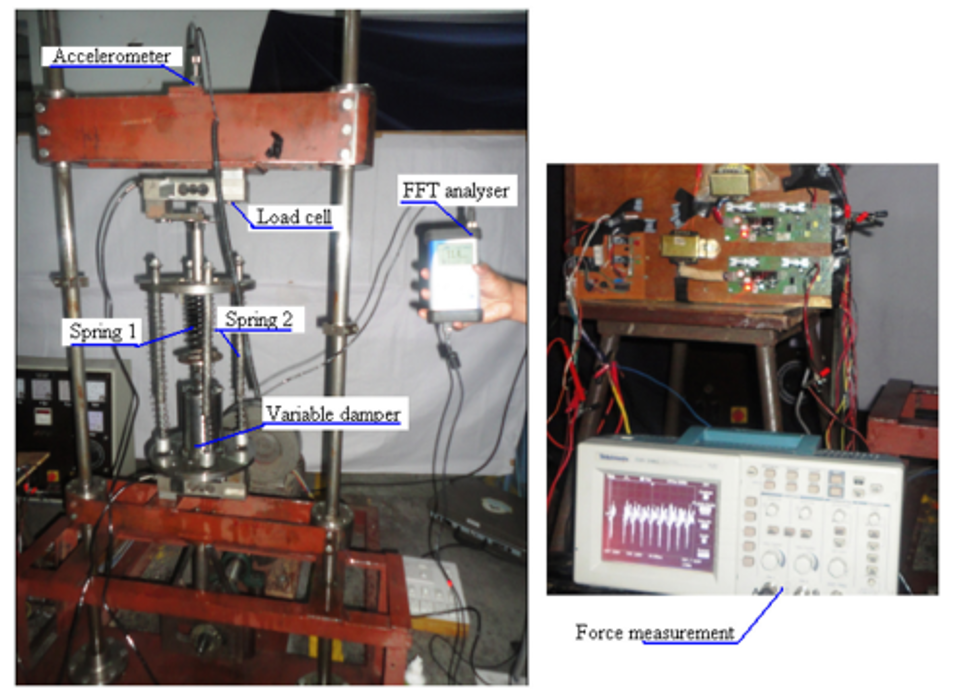
Test setup shown has been used to measure displacement
“...vibration meter is used to record sprung mass displacement and acceleration within the
test frequency range”
- Jugulkar et al., Advances in Mechanical Engineering
Using any one of an array of easy to use and readily available frequency-based sensing devices, you measure and extract the typical frequency domain data regarding the movement, vibration and sprung mass displacement for your shock absorber, and generate some very compelling data concerning your device. But you notice that the device doesn’t quite work how you expect. You notice some underlying system artifacts that you would like to analyze and compensate for in the next iteration.
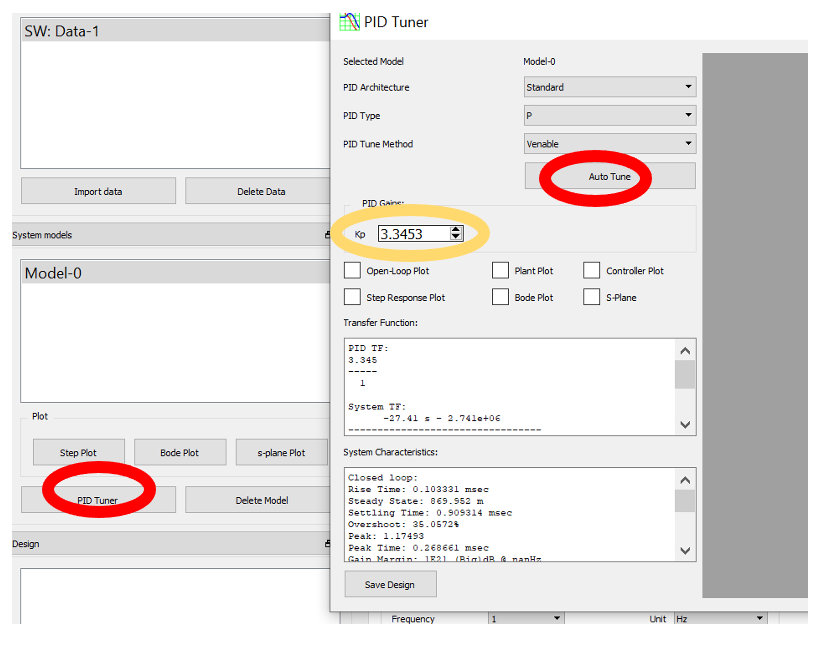
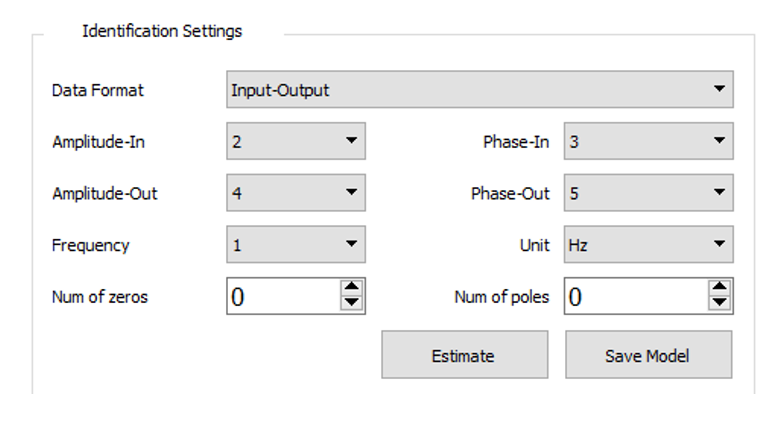
Now you have a choice. You can procure half a dozen costly and opaque data-analysis programs and painfully move into and out of each one, generating a little bit of insight here and there until you have enough to validate your design. Or you can consider using Venable Instrument’s System Identification, Analysis and Design software (SIAD) is specifically designed to make the next step of this process smooth and seamless. Using SIAD, you can easily estimate the transfer function from any measured frequency response data, translate it into the time domain, analyze the transient response, and tune a compensation model.
Using SIAD’s intuitive interface, you can quickly import and visualize your data, and build robust models, and tune the response with PID elements that can then be translated into practical realities. The software provides you with options to tune and assess the models. Using SIAD, you can visualize and identify system artifacts that didn’t appear in your initial analysis. What may have taken you days with several different software tools, can now be accomplished at the touch of a few buttons.
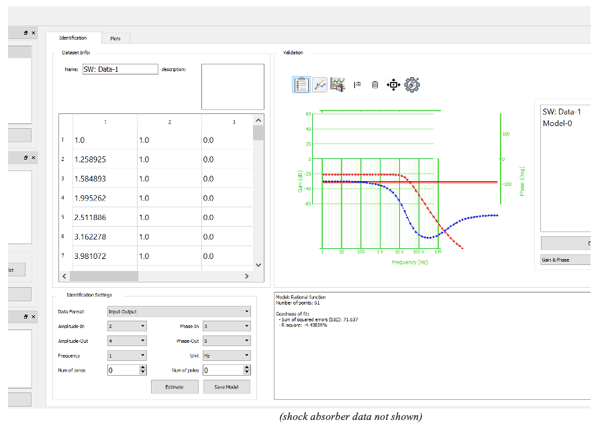
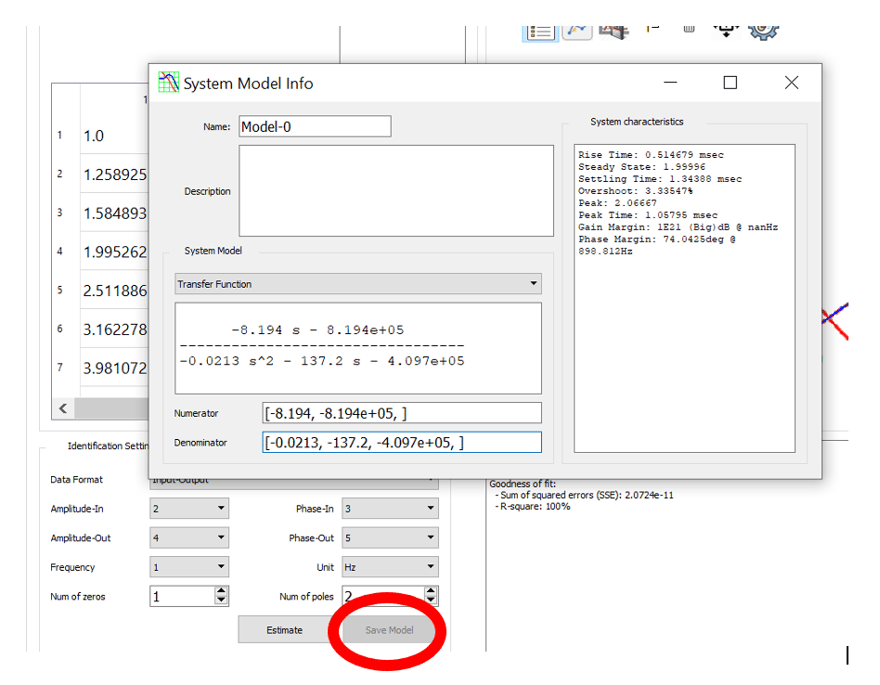
SIAD User Interface (data imported and modeled with just poles and zeros estimate)
SIAD used to generate an automatic model with excellent fit (100%) by providing a few simple and intuitive identification parameters
(data not shown not pertaining to any shock absorber response)
Having obtained a good theoretical model, SIAD allows you to introduce tuning elements to realize a more optimal system response that you can then introduce as corresponding design modifications into your physical design and get modified data that fits the desired response and is sure to please your boss and your customer!
Conclusion:
While lighthearted, the approach described here is a very feasible design route that could yield tremendous benefits for everyday engineers in numerous ways. PID tuning elements determined by SIAD can be correlated to mechanical realities like dampers to enhance and optimize system performance. The same approach can be taken in industries ranging from aircraft design to chemical manufacturing and SIAD software can play a practically relevant role in every such industry. Find out how SIAD can become your partner in progress, by requesting a trial.