Venable Bode plots are different from standard Bode plots. Unlike standard plots, gain and phase are plotted on the same plot with the left hand x-axis representing gain in dB and with the right hand x-axis representing phase in degrees. Phase is only plotted from -180 to +180 degrees and wrapped around if it exceeds these values. Phase margin is measured from the 0 degrees of phase and determined by inspection unlike a standard plot where the phase is subtracted from -180 degrees to get the phase margin. The following post explains how the Venable plot is derived from the standard Bode plot.
Equation 1 below is the closed loop transfer function of a closed loop negative feedback system, where G is the plant or power stage transfer function divided by the feedback factor 1+GH. GH is called the open loop or loop gain. It is the gain around the feedback loop.

Equation 1
In Figure 1, the gain is 65 dB at low frequencies and crosses over the 0 dB line at 32 kHz. The phase would start at zero for very low frequencies and it crosses over the 180 degree line at 169 kHz. The lines for 0 dB and 180 degrees of phase coincide on this plot.
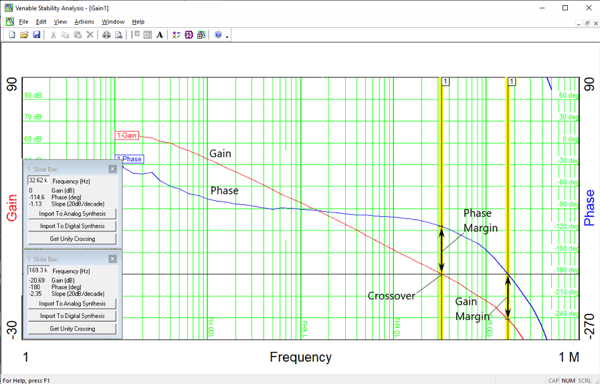
Figure 1
The phase margin is the amount of open loop phase shift at unity gain needed to make the closed loop system unstable. It is the difference in phase between 180 degrees phase shift and the measured phase at the unity gain crossover. In Figure 1, the phase margin is 180-114.6=65.4 Deg.
The gain margin in dB is the amount of open loop gain at 180 degrees phase shift to make the closed loop system unstable. It is the difference in gain between 0 dB and the measured gain where the phase crosses 180 degrees. In Figure 1, the gain margin is -20.7 dB and can be read directly from the plot.
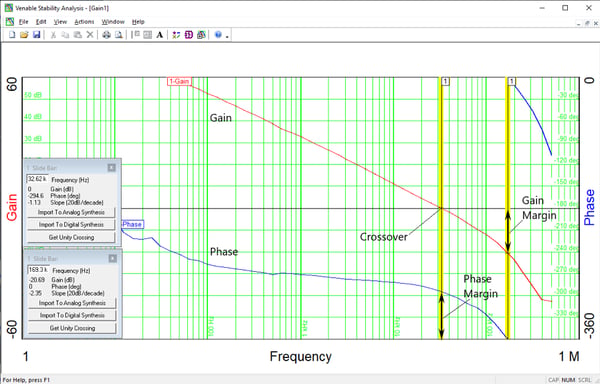
Figure 2
In the real world, when using an instrument to measure the loop gain of a feedback loop, the loop gain is actually –GH. Figure 2 shows what a real world measurement would look like. The negative sign in the loop gain is the inversion part of the negative feedback and the plot has 180 degrees of extra phase shift. The phase starts at 180 degrees at very low frequencies and the phase margin would be the difference in measured phase and 360 degrees (360-294.6=65.4 Deg) at the unity gain crossover. The gain margin in dB now is open loop gain at 360 degrees phase shift needed to make the closed loop system unstable (-20.7 dB).
Figure 3 is a Venable Bode plot of the same power supply. It eliminates the tedious task of subtracting the measured phase from 360 degrees and allows the user to read the phase margin directly from the plot like the gain margin. The phase is wrapped around to positive values by adding 360 degrees to any phase measurement greater than -180 degrees. Angular degree measurements, 360 degrees apart, are mathematically the same. 360 degrees is equal to 0 degrees and the phase margin can be read directly from the plot.
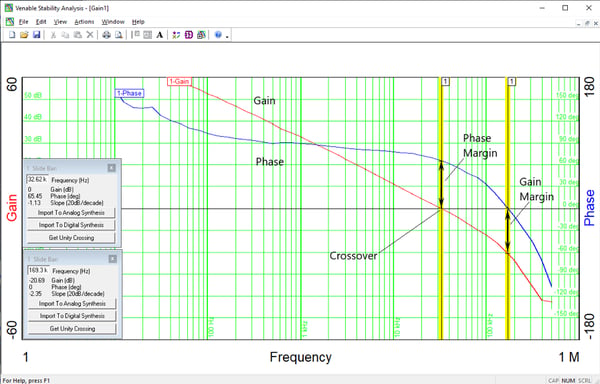
Figure 3
In conclusion, the Venable gain-phase plot takes into account the inversion or 180 degrees phase shift in the loop gain of a negative feedback loop in real world measurements. The plot also uses phase wrapping of measured phase greater than 180 degrees to allow the determination of gain margin and especially phase margin by inspection.
New users or those unfamiliar with making feedback loop measurements often have questions about using the Venable software and equipment. We intend to post a series of tutorial blogs specifically for these users. The next blog post will be on the topic of voltage injection levels for measuring feedback loop gain.