In my last blog post, we looked at how to determine the gain and phase margin using a Venable Bode plot.
This blog post will show how to inject the correct amount of voltage into a feedback loop in order to get an accurate and noise free plot.
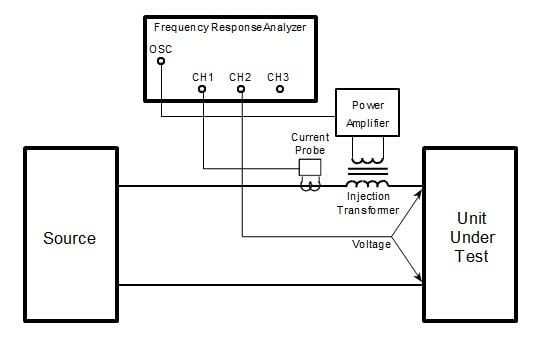
Feedback loop gain is measured by injecting a voltage in series at a point where the feedback is confined to one path and a low impedance is driving into a high impedance. This injection point is typically where the output of the power supply and the top of the resistor divider string of the error amplifier are connected. An injection resistor is placed in series at this point and a floating generator voltage is connected across the resistor. Channel 1 is connected to the error amplifier side of the resistor or input to the loop and ground. Channel 2 is connected to the power supply output side of the resistor or output to the loop and ground. A common question for those unfamiliar with this type of measurement is: How much voltage should be injected to get an accurate plot of loop gain?
Feedback loop gain measurements are small signal measurements. The main principal to consider when measuring loop gain is to minimize the injection level and still get a smooth, noise free data plot. One way to do this is to monitor the voltage readings on Ch. 1 and Ch. 2. The voltage readings in the Venable software are located on the Analyzer Control menu in the grayed text boxes below the Take Data at Start Frequency button. See Figure 2 below.
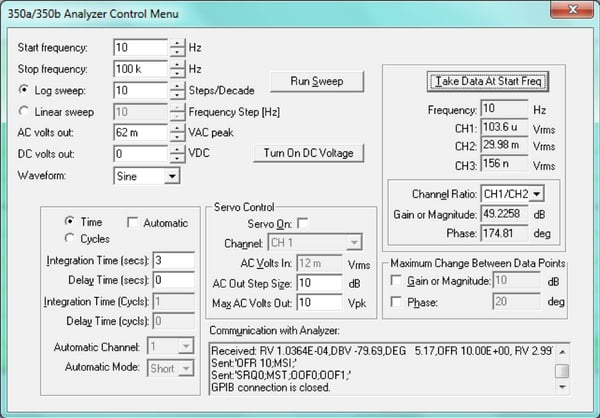
Figure 2 Analyzer Control Menu
The loop gains for power supplies at low frequencies have high gains. Assume that Ch.2 is measuring the output and Ch.1 is measuring the input of the loop gain. At low frequencies, the channel 1 voltage will be very small, it will be in the tens or hundreds of microvolts range, and the channel 2 voltage will be much larger, typically in the tens of millivolts. With a constant injection voltage level, the generator or V3, channel 2 or V2 and channel 1 or V1 form a vector triangle. See figure 3. At crossover frequency, they form an isosceles triangle where V1 = V2 and the difference in the phase between them is the phase margin. At low frequencies and high gain, V1 is very small, perhaps, as much as 1000 times smaller than V2 and therefore, V2 ≈ V3. You can use V2 or the channel 2 voltage reading to set the injection level into the feedback loop.
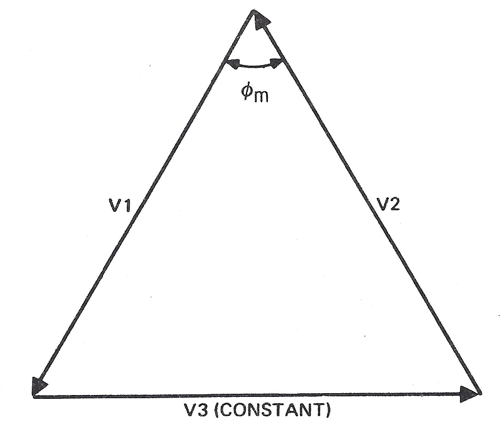
Figure 3 Vector Triangle
The best point to check and set the injection initial level is at the start frequency of the sweep when sweeping up. This will be the point where the gain is the highest and you will need to inject the largest signal. Open the Analyzer Control menu in the Venable software to set the Start Frequency and set the AC Volts Out from 40 to 100mV if you are injecting directly into the circuit with a floating generator. The AC Volts Out should be adjusted to a level 10 times higher if you are using a 10:1 step down transformer to float a grounded generator in order to be able to connect it to the injection resistor.
Left click on the Take Data at Start Frequency button. The analyzer will make continuous measurements at the start frequency. Observe the voltage level of channel 2 and adjust the AC Volts Out until the channel is reading between 20 to 30 mV. If the voltage readings are unstable, adjust the injection level and integration time. An increase in the injection level will move Ch. 1 away from the noise floor. Of course, there is a limit to how much signal can be injected in the circuit. An increase in integration time or cycles increases noise rejection in the measurement but will slow down the sweep. When you are satisfied with the stability of the measurement, click on the Run Sweep button to start the sweep.
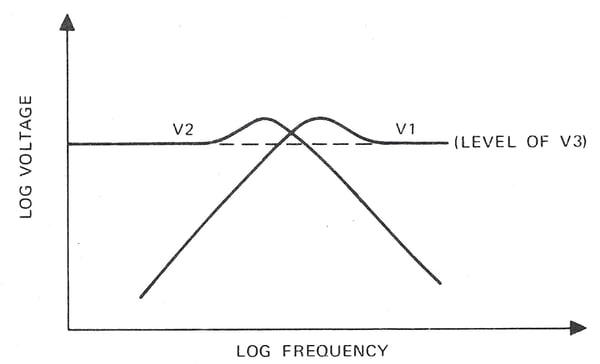
Figure 4 Channel Voltage Levels in a Loop Gain Plot
You can let the sweep run to completion at this point. However, all the controls on the Analyzer Control menu are fully interactive and can be changed during the sweep. Figure 4 shows the voltage levels for each channel and compares them to a fixed voltage injection level for a typical loop gain measurement. Channel 2 or V2 stays fairly level until crossover while channel 1 or V1 rises to meet it. The converse occurs after crossover. Channel 2 rolls off while channel 1 approaches the fixed injection voltage.
Once the gain has been reduced at higher frequencies, voltage injection levels can be reduced as channel 1 rises farther above the noise floor. This helps reduce the chance that any errors are introduced into the measurement by high injection levels at higher frequencies. There is also better noise rejection at higher frequencies because more data is processed by the DFT. For the same reasons above, the integration often times can be reduced to speed up the sweep. Keep in mind that changing the injection voltage level should not cause any discontinuities in the plot. If that is the case, injection levels may be too high in the first place or have been reduced too much. Reducing the integration time may cause the plot to become jumpy or noisy. Perhaps, in that case, the integration time should not be reduced because of the noise levels in the circuit.
Remember that loop gain measurements are small signal measurements. You should, in all cases, minimize the injection level as much as possible and still get a good smooth noise free plot. This will minimize the chance of introducing nonlinearities that can cause errors in the measurement.
In the next blog post we will talk about how to easily and precisely set the voltage injection level into a feedback loop using the Servo function on the Analyzer Control menu.
Read related conent:
NEW SIGNAL INJECTION TECHNIQUE WP
FEEDBACK LOOP CHARACTERIZATION AND COMPENSATION
USING THE SERVO TO SET FEEDBACK LOOP INJECTION LEVELS FOR MEASURING LOOP GAIN
DETERMINING GAIN AND PHASE MARGINS ON VENABLE BODE PLOTS