M-CRPS Input Impedance Test Procedure Using a Venable FRA
By Michael Gray - November 04, 2024
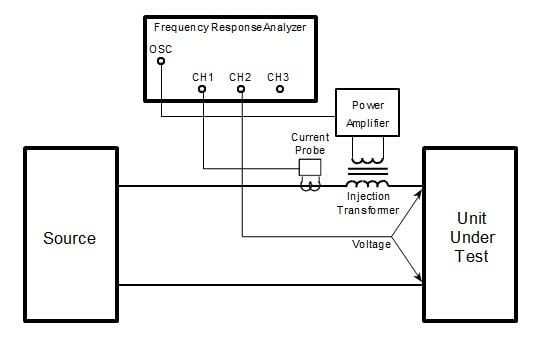
A customer inquired about testing input impedance using the M-CRPS Set-Up (Modular Hardware System-Common Redundant Power Supply Base Specification). In this blog post, we compare the M-CRPS test setup (Figure L-1 Input Impedance Measurement Setup), with the Venable Instruments test set up featuring a three-channel Venable Frequency Response Analyzer in Figure 1. This guide will help you understand the process and optimize your measurements effectively.
The Open Compute Project (OCP) uses the open-source model to develop and standardize server and data center hardware. M-CRPS (Modular Hardware System Common Redundant Power Supply Specification is part of the Data Center – Modular Hardware System (DC-MHS). The latest M-CRPS specification is Version 1.05.00 RC5 dated Sept. 25, 2024. Section 5.3.4 of the M-CRPS requires vendors to measure and characterize input impedance of the power supply.
Supplemental Material O. provides a DC input impedance measurement setup as shown in Figure L-1 from the specification below. The analyzer voltage channel input voltage rating should be considered and a 10:1 or 100:1 probe chosen if needed. A shunt or current probe with at 1 MHz bandwidth is needed for the current measuring channel. A typical sweep range will be from 10 Hz-100 kHz and the injection level should be as small as possible and still get a good plot. Injecting a disturbance with an NMOS in series with the input is a very inefficient. The NMOS will require cooling since it passing all the input current with a fairly large voltage drop.
 Figure L-1. Input Impedance Measurement Setup
The Venable Input/ Output Impedance Test Set is a turnkey solution that that is made for this application. It consists of a 50A or 100A high saturation secondary injection transformer and a 440 W or 900 W power amplifier. The injection transformer secondary is placed in series with the high line and replaces the NMOS device in the screen shot. The power amplifier input is connected to the source or oscillator and the amplifier output is connected to the transformer primary to inject a sine wave disturbance into the power supply. A current probe is connected to channel 1 to measure the current and the voltage is measured by channel 2 (and/or channel 3). The Venable analyzer oscillator and channels are isolated up to 600V. The input channels auto range and have a maximum input range of 500 Vpk. Typically, 10:1 or 100:1 voltage probes are not needed for most measurements.
Note in the Venable test setup below that the current is sensed on the high side. The current probe is oriented with the arrow pointing into the input terminal of the impedance for positive polarity. The current probe output is terminated by the 50-ohm input of the oscilloscope which is used to monitor the current and injection levels. The Venable FRA software can plot the measured inductance directly to a reactance plot as a function of frequency after the current probe is scaled correctly.

Figure 1 Voltage Injection Test Setup for Measuring Input and Output Impedance
- Frequency Response Analyzer CH3 = Voltage across the load input
- Frequency Response Analyzer CH2 = Voltage across the source output
- Frequency Response Analyzer CH1 = Voltage across Rsense or scaled output of Current Probe Amp
- Source Output Impedance = -CH2 x Rsense / CH1
- Load input Impedance = CH3 x Rsense / CH1
- Scale factor = Rsense or Effective Resistance of the Current Probe
Current probes are directional. If the arrow on the current probe is pointing toward the load, then the measured impedance of the load will be the positive polarity. CH2 has a negative sign because the probe is pointing away from it. The scale factor of the data set will be the effective resistance of the current probe, which is the rated volts per division of the current probe amplifier output divided by the amps per division setting of the current probe amplifier.
- TCP300 Current Probe Amplifier Output Voltage Scale = 1V
- TCPA300 Scale Factor = 1V/Current Range
- Example Scale Factor or Effective Resistance = 1V/5A = 0.2Ω
The calculated scale factor or effective resistance is entered into the Scale factor text box in the Data Set Properties window as shown in the screen shot below.

Figure 2 Data Set Properties
The impedance of a power supply is plotted directly to an Impedance or Reactance plot. Below is a screenshot of an Impedance plot in Venable software. The measured impedance will be plotted directly onto this plot if the current probe is scaled correctly. The slide bar cursors are used to measure the power supply’s capacitance, resistance, and inductance as a function of frequency. The negative input resistance is about-1.95239k ohms.

Figure 3 Power Supply Input Impedance
The low frequency capacitance is 3.067uF and the high frequency inductance is 204.13uH. These values conform to the green grid lines on the plot. The resistance values are the horizontal grid. The capacitive values are at -45-degree angle going from upper to the lower part of the plot with respect to frequency. The inductive values are at 45-degree angle going from lower to the upper part of the plot with respect to frequency. The values at 0, +/-90, and +/180-phase crossover points can be examined using the phase crossing function.
Supplemental Material O requires input impedance test be performed with the input voltage set at the minimum, typical, and maximum levels. The test will be performed with output load set from 0% to 100% in 10% for a total of 11 measurements.
As shown in Figure L-2, the minimum inductance is calculated by getting the input impedance at the -90
 Figure L-2. Sample Impedance/ Phase Plot
degrees phase crossover and plugging the values into the following equation to calculate the input inductance Lin. Find the minimum input inductance from all the impedance test data. This inductance should be greater than or equal to a minimum input inductance, Lin of 11mH/kW.

Equation 1
However, this method will lead to incorrect (or misleading) input inductance measurement results. The impedance at the crossover point of -90 degrees is capacitive in Figure L-2. Using the impedance of the crossover point in Figure 3 above, the capacitance can be calculated from the impedance magnitude and frequency.

Equation 2
This calculation will match the slide bar cursor reading at 184.658 Hz in Figure 3. An objection might be made that maybe a negative inductance is being measured. A negative inductance will have the same response as a positive inductance, increasing impedance magnitude with frequency, but the phase is shifted by 180 degrees. Also, in Figure 3, there are three inductances due to filtering. Which is the correct input inductance?
For the M-CRPS test, the Input/Output Impedance (IOZ) Test Set option in conjunction with a current probe and Frequency Response Analyzer (FRA) can be used to measure the input or output impedances versus frequency of switching power supplies. The amplifier and injection transformer of the IOZ Test Set provide the drive and isolation to disturb the power line with the analyzer oscillator. The analyzer channels along with the current probe enable the measurement of the input or output impedance of power supplies without any extra accessories at voltages of up to 500 Vpk.
Post publication, Michael addressed a few customer questions available here.
Related Content Posts
Source/Load Impedance Measurement Injection Methods
Measuring the Input and Output Impedance of Power Supplies (Part 1)
Measuring Impedance of Power Supplies - Current Probe and Scale Factor (Part 2)
Measuring the Input and Output Impedance of Power Supplies (Part 3)


